

Blog
Transforming Workato Operations with a Unified Recipe Monitoring Dashboard
- May 26, 2026
- Veera Shivaji Nayineni
Introduction: The Operational Challenge Behind Scaled Integrations
Managing hundreds of Workato recipes across multiple projects shouldn’t mean jumping between tabs and firefighting failures manually. Yet for most enterprise support teams, that’s exactly the reality. This blog explores how Prowess Software Services built a unified Workato Recipe Monitoring Dashboard to bring real-time visibility, diagnostics, and control into one operational screen.
Workato is a powerful enterprise automation solution and integration platform. However, as integration landscapes expand, operational complexity also increases. At a smaller scale, managing recipes is straightforward. At enterprise scale with hundreds of recipes across multiple projects, it becomes a very different problem.
Support teams often find themselves:
- Jumping across projects
- Navigating multiple Workato screens
- Investigating failures manually
- Piecing together operational health from fragmented views
At Prowess Software Services, we observed that while Workato delivers excellent integration capabilities, support and operations teams still face several hidden operational challenges in day-to-day recipe management.
The result:
- Slower troubleshooting
- Delayed incident response
- Reduced operational visibility
- Increased operational overhead
This led us to build a centralised operational solution:
A unified Workato Recipe Monitoring Dashboard designed specifically for enterprise-scale integration operations.
The Problem We Couldn't Ignore
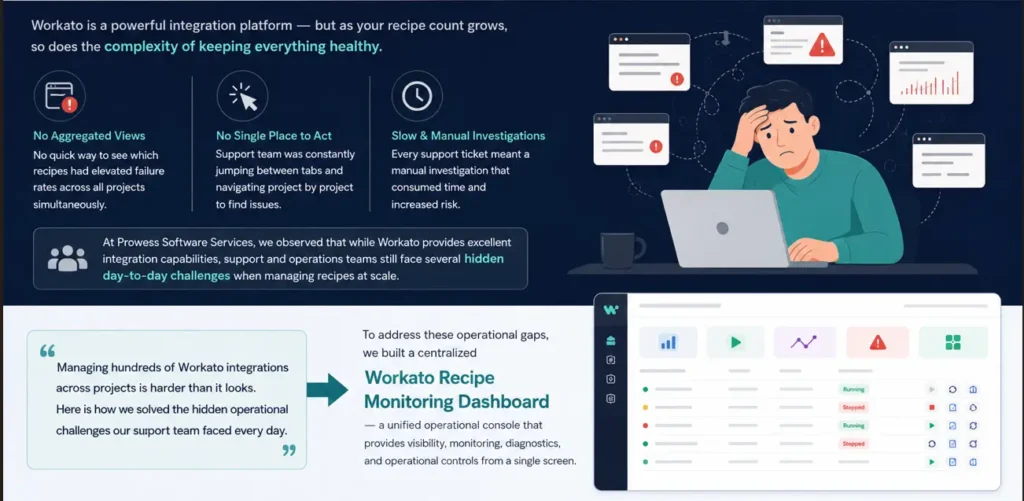
Workato is a powerful integration platform — but as your recipe count grows, so does the complexity of maintaining everything in good health. Our support team was constantly firefighting: jumping between tabs, navigating projects by project, and manually piecing together what was failing, why, and where.
There were no aggregate views. No quick way to see which recipes had elevated failure rates across all projects simultaneously. No single place to act. Every support ticket meant a slow, manual investigation that cost time and increased risk.
At Prowess Software Services, we observed that while Workato provides excellent integration capabilities, support and operations teams still face several hidden day-to-day challenges when managing recipes at scale.
“It’s harder than it looks to manage hundreds of Workato integrations. This is how our support team was able to overcome the hidden operational challenges they faced on a daily basis.”
To address these operational gaps, we built a centralised Workato Recipe Monitoring Dashboard — a unified operational console that provides visibility, monitoring, diagnostics, and operational controls from a single screen.
The Hidden Operational Challenges in Workato
As integration landscapes expand, support teams encounter recurring operational issues that impact productivity and incident resolution time.
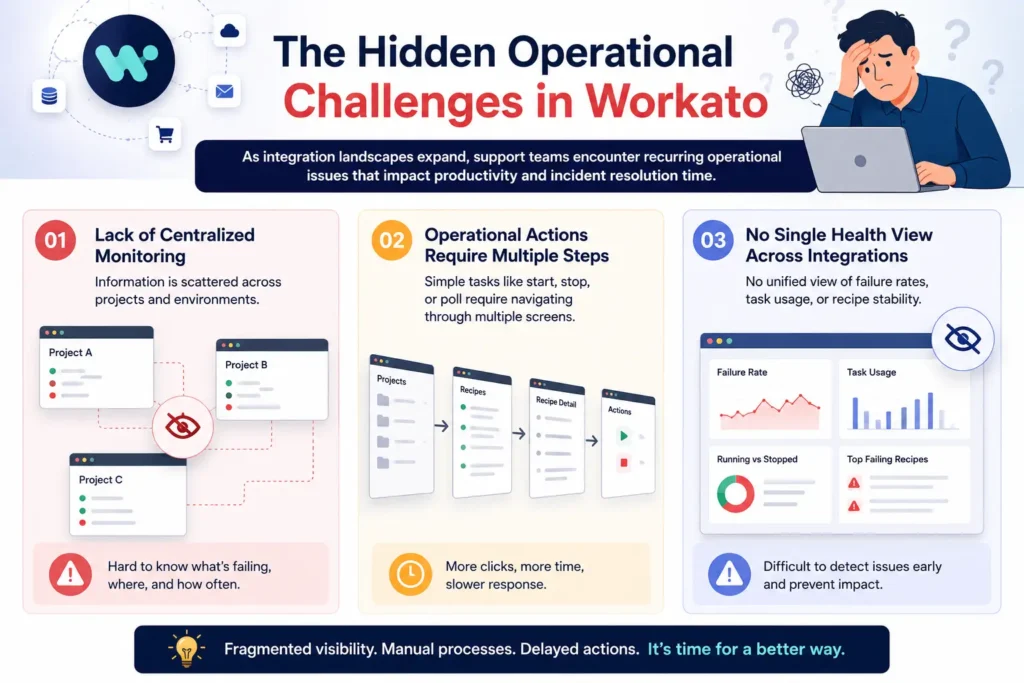
1. Lack of Centralised Monitoring
Support teams often need to navigate across multiple projects and recipes just to understand:
- Which recipes are currently running
- Which integrations are failing
- Failure trends
- Execution statistics
- Task consumption
Without a centralised view, identifying platform-wide issues becomes time-consuming.
2. Operational Actions Require Multiple Steps
Simple operational activities such as:
- Starting recipes
- Stopping recipes
- Triggering poll executions
- Reviewing execution history
usually require navigating deep into Workato projects and recipe editors.
This slows down support operations during critical production incidents.
3. No Single Health View Across Integrations
Operations teams need immediate answers to questions like:
- Which recipes have high failure rates?
- Which projects are unstable?
- Which integrations consume the highest task volume?
- Which recipes stopped unexpectedly?
Standard operational visibility is often fragmented.
The Solution: A Purpose-Built Dashboard
To address these operational gaps, Prowess Software Services developed a centralised Workato Recipe Monitoring Dashboard.
The dashboard acts as:
- A unified operational console
- A monitoring layer
- A diagnostics platform
- A centralised control interface
All from a single screen.
The solution integrates directly with the Workato API to provide:
- Live operational visibility
- Real-time monitoring
- Actionable diagnostics
- Operational controls
Core Capabilities of the Workato Recipe Monitoring Dashboard
1. Unified Real-Time Monitoring Across All Projects
The dashboard displays all Workato recipes in a single operational view, enabling teams to instantly identify:
- Running recipes
- Stopped recipes
- Failure-prone integrations
- Task execution patterns
- Project-level health
This significantly improves operational awareness across environments.

The dashboard provides critical operational KPIs at the top of the screen for quick visibility.
- Total Recipes
- Running Recipes
- Lifetime Tasks Executed
- Average Failure Rate
- Total Projects
These metrics help support teams quickly understand overall platform health.
3. Recipe-Level Operational Intelligence and Execution Metadata
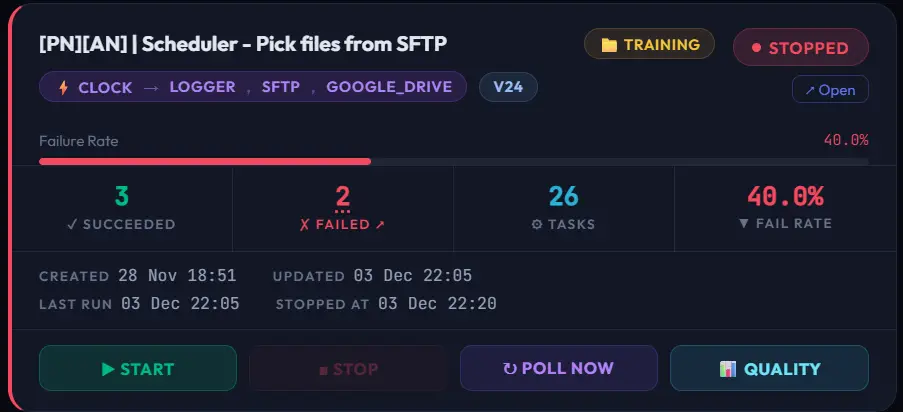
Every recipe is displayed as an operational card containing detailed metadata and runtime information.
- Recipe Name
- Project Information
- Running Status
- Trigger Type
- Applications Used
- Version Details
- Failure Percentage
- Success and Failure Count
- Task Consumption
- Last Run Information
This gives support engineers immediate context without switching between multiple Workato screens.
4. Operational Controls and Actions from a Single Screen
One of the biggest operational improvements is the ability to perform actions directly from the dashboard.
- Start Recipe
- Stop Recipe
- Poll Recipe
- Open Quality Report
This eliminates the need to manually navigate across multiple Workato interfaces during support activities.
Real Business Impact: From Reactive Firefighting to Proactive Monitoring
Since deploying the dashboard, our support team has moved from reactive firefighting to proactive monitoring. Recipes with rising failure rates are spotted and addressed before they escalate. Routine actions that used to require navigating multiple Workato screens now take seconds.
The dashboard is now the first screen our support team opens every morning — and the last one they check before signing off.
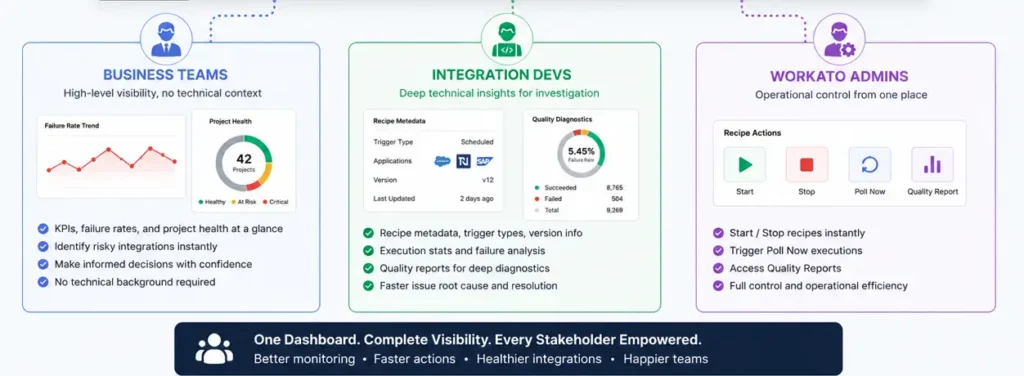
Built for Every Stakeholder: Support, Developers, and Business Teams
The dashboard was designed to support multiple operational audiences simultaneously:
- Support teams
- Integration developers
- Workato administrators
- Business operations teams
Each audience benefits from:
- Faster visibility
- Simplified diagnostics
- Centralised operational intelligence
Business Teams
Why Centralised Workato Monitoring Matters for Enterprise Automation
As enterprise automation adoption increases, operational complexity grows rapidly.
Integration teams no longer need just automation capabilities — they also need:
- Operational observability
- Faster troubleshooting
- Proactive monitoring
- Centralized governance
- Simplified support operations
A unified monitoring dashboard bridges this operational gap and transforms how support teams manage enterprise integrations.
Architecture Perspective: From Workato Integration to Operational Intelligence
Traditional integration platforms focus on:
- Connectivity
- Automation
- Workflow execution
But enterprise-scale operations require an additional layer:
Operational intelligence.
This dashboard introduces that layer by combining:
- Monitoring
- Diagnostics
- Operational control
- Real-time visibility
into a unified operational experience.
How Prowess Software Services Helps
At Prowess Software Services, we help enterprises build:
- Scalable Workato integration ecosystems
- Centralised operational monitoring solutions
- AI-ready automation architectures
- Real-time integration observability platforms
We combine:
- Integration
- Automation
- Monitoring
- Operational intelligence
to enable resilient, enterprise-grade automation landscapes
Conclusion - Simplifying Enterprise Workato Recipe Operations at Scale
Workato provides a powerful foundation for enterprise automation.
But operational scalability requires:
- Centralized visibility
- Simplified monitoring
- Faster diagnostics
- Unified operational control
The Workato Recipe Monitoring Dashboard, built by Prowess Software Services, enables organisations to:
- Improve operational visibility
- Reduce troubleshooting effort
Accelerate support response
· Move toward proactive integration operations
With centralised operational intelligence, support teams can spend less time navigating systems—and more time ensuring reliable enterprise automation.
Ready to Transform Your Workato Operations?
Stop firefighting recipe failures manually. Let Prowess build you a unified Workato recipe monitoring dashboard designed for enterprise-scale integration visibility, proactive monitoring, and faster incident response.
Get a Free Workato Operations Consultation
No commitment required. Just a conversation about your integration challenges.

Editor: Veera Shivaji Nayineni
10 Frequently Asked Questions
A Workato Recipe Monitoring Dashboard is a centralised operational console that provides real-time recipe visibility, integration health monitoring, diagnostics, and operational controls for managing Workato automations at enterprise scale.
Centralised monitoring helps enterprise support teams quickly identify recipe failures, track integration health across projects, reduce mean time to resolution (MTTR), and improve operational observability, replacing manual, project-by-project investigation.
It solves fragmented integration visibility, slow incident response, operational inefficiency, lack of cross-project health dashboards, and the absence of proactive failure detection in large Workato environments.
Key metrics include:
- Running and stopped recipe counts
- Failure rate percentage
- Task consumption trends
- Job Execution history
- trigger types
- Project-level health scores
- Lat run timestamps
Yes. A well-designed Workato operations dashboard enables direct controls such as starting and stopping recipes, triggering poll executions, reviewing recipe job history, and opening quality reports without navigating individual recipe editors.
It reduces manual investigation effort, shortens incident response time, enables proactive integration monitoring, and shifts support teams from reactive firefighting to predictive operational management of enterprise automation.
Common issues include unexpected recipe failures, task consumption spikes, unstable integrations, hidden execution errors, cross-project visibility gaps, and the lack of a unified recipe health view.
Real-time integration monitoring allows operations teams to detect failures early, track recipe execution trends, maintain SLA compliance, reduce automation downtime, and ensure continuous integration reliability across the enterprise.
Yes. Workato’s REST APIs allow developers to retrieve live recipe status, job execution data, failure statistics, and task metrics, enabling custom operational intelligence dashboards tailored to enterprise needs.
As enterprise automation scales, teams need integration observability to ensure governance, compliance, faster root cause analysis, SLA adherence, and centralised control over hundreds of automated workflows and business processes.